

Too often than not, companies are eager to jump into split-testing as soon as possible, but most of them do not do proper analytics setup.
By doing this, they are shooting themselves in the foot – no analytics setup means there’s no proper gauge to show if the experiment you’ve run is a win or not.
And a crappy analytics set up is even worse – not only the test is not being measured properly, but the leadership can be mislead into making ill-advised decisions based on the incorrect data.
The bare minimum

The very least you can do to prevent doing things blindly is to set up GA session and goal tracking. And while the former is done by simply putting Google Analytics code site-wide, the latter involves defining some of the key actions that you want visitors to make on your website.
Aside from the obvious benefit of having the core actions measured, this actually can provide immense value to those who are just starting out. Setting up these goals makes you think of the marketing activities – and business as a whole – not in terms of the marketing budgets and clicks first, but rather in terms of the actions that you want your online presence to facilitate.
For example, if a food supplement company decides to try and do the minimum analytics setup, their goal outline would likely start out like this:
- Visited the product page.
- Added a product to cart.
- Bought the product.
Now, mind you, one of the items in the list is not like the others – you have no reasons to want your purchases being tracked by a simple Google Analytics goal, since GA has a very robust mechanism of tracking purchases – as well as revenue – that is built precisely around monetary value that you want your website to generate.
If the website in question is not, technically speaking, a hopelessly complex dump of unintelligible code, the three above goals should take you anywhere between an hour to a day to set up. Worst case scenario, you’ll have to email the instructions to the developer and tell him to install a piece of code here and another snippet there, and you’re done.
Important: it's usually best to set up interaction goals as product page visits or cart additions as event goals, not as URL visit goals. Reason being the fact that the URL visit goals only track a 'flag' of whether such action has or has not been accomplished by a visitor in a session, whereas the event goals track each individual action and you can have data on both the unique events and the aggregate totals. This is especially important if you're dealing with an eCommerce website that has multiple products to add to cart, as opposed to a single-product website or a lead-gen landing page.
Luckily, Google Analytics does have a very detailed developer portal, explaining the code and snippets you have to use to track pageviews, events and sales. For some of the most popular platforms, the plug-ins and integrations are also plentiful.
If you do this minimum amount of tracking set up, you will already have a very basic funnel that you can analyze. With these stages of the visitor journey outlined and measured, you can already see whether most visitors make it to the cart of just helplessly wander through the site, unable to make out how to pay you money. And using the default segmentation options Google Analytics provides out-of-the-box, you can have a more granular look at the insights by device, OS, location and browser. And should you enable display features in your GA property, you’ll also be able to segment your reports by age, gender, and Google’s proprietary audiences.
Completing the puzzle

If you are looking at the funnel above and start wondering “How do I know what exactly is wrong with, say, the cart page?”, you’re asking the right questions! And bolstering the web analytics set up is one of the actions you can take to fill the gaps in the complete picture.
Let's see how we can expand on that bare minimum.
Construct a more detailed funnel
One of the easiest things you can do to know more about your website’s performance is to add more steps to your funnel. And by that I do not mean adding more steps to the actual process, but rather treating different actions along the funnel as separate micro-conversions. Taking the aforementioned food supplement shop example further, a more detailed funnel could look something like this:
- Visited the catalog page.
- Visited the product page.
- Engaged with the product configuration.
- Added a product to cart.
- Made it to checkout.
- Started filling out the checkout form fields.
- Filled out every required form field.
- Went to the payment gateway.
- Bought the product.
As you can see, by considering the complete visitor journey brick by brick, you can get into the nitty-gritty of the purchase process and expand the funnel greatly – the outline above has grown from 3 to 9 steps, and this is still a somewhat generalized view. For different websites and checkout flows, you could go as far as tracking individual fields and field sets that are specific to the flow.
Of course, tracking this level of detail is a little bit harder to set up, but it’s not impossible, especially if you have a good developer available.
Gather heat map and session recording data
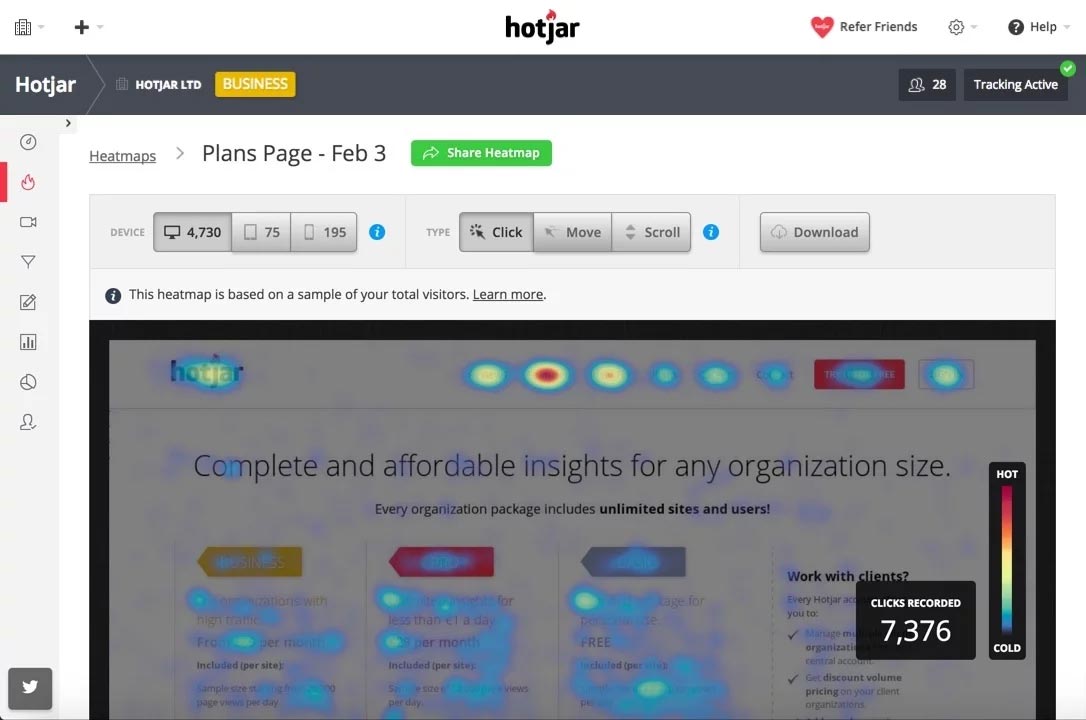
Another way to find out where the users are struggling is gathering heat maps and session recordings. One of the best tools I know is HotJar, but there are many others like Inspectlet, Mouseflow, LuckyOrange etc.
Most of the heat mapping tools are easy to integrate with a single code snippet, and require little to no configuration.
After you’ve started gathering the heat maps, you’ll be able to see which elements of your website pages are getting the most clicks, and which aren’t. And oftentimes, you can get very surprised by how different is the actual usage from the intended.
Session recordings take the concept even further and allow you to look over the shoulder of individual visitors by showing you the page sections each visitor has looked at, elements hovered, buttons clicked and fields interacted with.
Heat maps and session recordings are great tools for discovering specific pain points, but they have a serious downside to them – it takes time to look through the numerous recordings and heat maps and you can get easily overwhelmed by the amount of data available. That is why I recommend to use these tools after you’ve identified the specific stage at which visitors are struggling, and then narrow down your search to that specific area.
There's a couple of things to consider when dealing with the heat mapping software. In a recent thread in CXL Facebook group, Tim Stewart mentioned these points:
Bear in mind that heatmap tools approximate where the clicks happen, bundling by reported screen size but not necessarily getting it right. Screen size does not equal actual viewable browser/layout.
...
Aside from desktop/tablet misclassification by screen size, clicks in text (real hotspots, not the odd blip) are often misidentified clicks in a different viewport/layout, displaced from the actual link position.
...
[Heat mapping tools are] useful as a general guide but I wouldn't be trusting the data too closely or inferring any demographic or user intent behaviour ... heatmaps on one page are also symptomatic of where they are in the whole journey and buying cycle
So do use the heat mapping tools, but do so mindful of your time and tool's accuracy. Do not trust any single analytics tool blindly – neither for heat maps nor the others.
Implement Enhanced eCommerce fully

If you’re serious about slicing and dicing the eCommerce data on your website, you should also look into implementing the Google Analytics Enhanced eCommerce functionality.
If done right, it gives you a more detailed look into product impressions, cart additions, checkout steps, sales, refunds and an ungodly amount of other information about all the little things that happen in your online shop.
While the Google Developers portal is very detailed and usually helpful, it might be a good idea to explore some integrations that are available for the most popular platforms, since mapping out all of the e-shop actions can be cumbersome, and prone to errors.
Track site search
An easier thing to set up is site search tracking. By checking literally one checkbox, you can start gathering all the search queries visitors submit on your website, and gather insight on what they might be looking for.
The setup is a little trickier if your website is using POST-based search, but it shouldn’t take too long to sort this out with a developer.
Track content grouping
For content-heavy websites, it often makes sense to set up different content groups to distinguish between page types (homepage, category page, blog post, author profile), content categories (blog post, search results, checkout process) and website areas (blog, shop, user profile).
Enabling and using Content Groups allows you to do just that. With a little bit of work, you’ll be able to set up these groups and look at the stats for each type of your website’s content that you couldn’t look at otherwise – an average bounce rate for every blog post or an average session time for people that have landed on the shop pages vs. the homepage)
Looking beyond sessions
Even though Google Analytics does have the Users metric up its sleeve, the vast majority of GA reports have been historically based on sessions. And while it is useful to distinguish between the two and look at both, people tend to make buying decisions based on multiple engagements with the website, so session-based approach sometimes just doesn’t cut it.
That’s why Google Analytics has a strong competition when it comes to user analytics – tools like KISSmetrics, Mixpanel and Amplitude have built robust event-based analytics tools around the concept of user journey rather than sessions, allowing you to track funnels more precisely and detailed, up to the point of looking at each individual user’s browsing and interaction history.
Aside from the (usually) higher price, these event-based analytics tools also have other downsides – they are somewhat harder to set up and require you to invest substantial time and effort into proper tracking compared to, say, Google Analytics or HotJar.
But if you give it a good thought – and do not botch the implementation – you are very likely to end up with a gold mine on your hands because you’ll be able to look at your visitors’ journey across sessions and devices, and build and analyze your funnels with more awareness and clarity.
Conclusion
This article does give a fair amount of information on what to set up, and why. None of the tools in here (except “Bare minimum”) are required to make educated decisions, but they tend to help.
It is also important to understand that setting up every tool or functionality mentioned in the article is not guaranteed to help you unless you understand the ‘why?’ behind setting it up. So do understand your personal 'why?' and reap the insights those tools provide with defined intention to know your visitors and customers better than you do now.